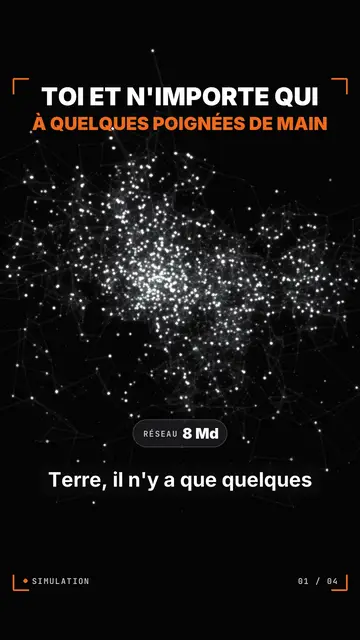
此風格的呈現效果
Particle swarm brings your topic to life as thousands of glowing dots on a black background. From afar, the swarm floats in 3D like a crowd or a galaxy. Closer in, it becomes a graph of nodes linked by thin lines. On the spoken word, the dots change colour: two orange and green camps pulling apart, a mix, or a red contagion starting from one point and spreading across the whole network from the previous shade.
The camera can dive down to a single node, where a glowing orange orb appears in the centre. Orange target corners frame the image, mono text in the corner reads “SIMULATION · REPORT” and a “02 / 04” counter gives the step. The title is in white capitals with a second line in orange, and interface cards fade in at the centre: profile, report, terminal, gauge, thermometer or number, with a dark veil to stay readable.
適合的主題
Avoid: topics that need to show a specific place, object or face: here everything is dots and lines. Also avoid step-by-step tutorials; the swarm illustrates group dynamics, not actions.
- Networks and links between peopleThe node graph shows concretely that everyone is linked to everyone.
- Opinion and polarisationOrange and green camps pulling apart make a debate or a vote visible.
- How rumours and viruses spreadThe red contagion spreading through the network shows how fast something spreads.
- Simulations and AITarget corners and the SIMULATION counter give the feel of an experiment in progress.
此風格的影片創意
- Six degrees of separation
The swarm of 8 billion, Milgram's 1967 experiment, then Facebook in 2016 and its 3.57 degrees.
- How fake news goes viral
The red contagion starting from one node, the share counter and the final report.
- Why online debates polarise
The two camps pulling apart, the gauge of the orange share and the dive to a profile.
- What the algorithm knows about your network
The graph of your contacts, the orange orb on you and the profile card.
只需 1 次點擊即可取得
- 開啟此風格的連結
點擊「以此風格建立影片」按鈕,即可開啟編輯器並預先選好此風格。沒有帳號的話,註冊只需一分鐘,也不需信用卡。
- 用一句話寫下你的主題
一個想法就夠了。你也可以貼上文字,或在 Starter 方案中對麥克風講述:影片會以你的聲音為基礎來製作。
- 檢視,然後渲染
AI 撰寫場景,依照文字時間點安排風格元素,並加入語音與字幕。你可以修改不妥之處,幾分鐘後即可取得直式 MP4。
你可以調整的項目
For each scene you pick the two title lines and the line below, the view (cloud, graph or zoom), the shade (none, camps, mix, contagion or red), the share of each camp, the word where the shade changes, the orb, an interface card, up to three small labels, the progress pill and the corner text.
常見問題
免費與否、輸出格式、用途:簡短解答。
Do the dots represent real data?
The swarm illustrates a dynamic, it does not plot a dataset point by point. Exact figures go through the cards and labels, which you write.
可以用我自己的聲音嗎?
Yes. Record yourself or import your audio: colours change and the camera dives on your words.
How is it different from Miniature islands?
Miniature islands shows a society as a 3D diorama with pawns and houses. Particle swarm reduces everything to glowing dots and links, to show a whole network.
此風格有免費方案嗎?
不是,它包含在 Starter($29/月)中:每月 15 支無浮水印影片,全部 81 種風格,外加你自己的風格。免費方案每月提供 3 支附浮水印的影片,另有 8 種風格:Pixel News、Press paper、Comedy cartoon、Class sketch、Night tale、Social screen、Retro synthwave 和 Flat vector。
如果你喜歡這種風格
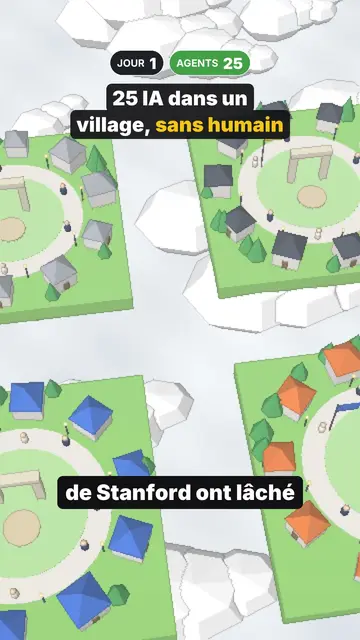
3D diorama simulation video
Miniature islands style · Pastel 3D villages floating over a sea of clouds, flown over then visited street by street.
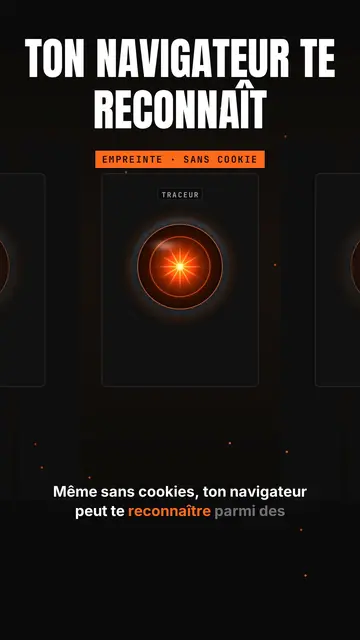
AI and privacy explainer video
Glowing eye style · A glowing orange lens-eye like an onboard computer on black, with a giant capital title.
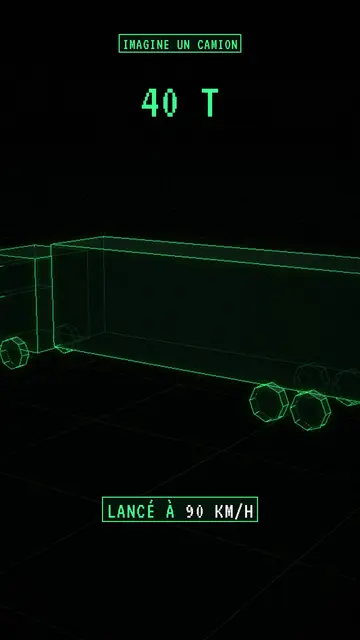
線框動畫影片
線框風格 · 網格地面上的霓虹綠線框 3D 物件。